New data published by the National Endowment for the Arts has revealed half of all adults created arts and/or performed art between July 2021 and July 2022.
But what do the numbers mean for your arts organization? CultureSource caught up with the NEA’s director of research and analysis, Sunil Iyengar, to learn more about how arts organizations can develop programs in response to these insights and eliminate barriers to arts participation.
What were your hopes for this study when you started it? Did the results mirror what you anticipated you’d find?
We’ve been doing this study roughly every five years, going back to the early 80s in fact, so we have a lot of historical data collected in partnership with the US Census Bureau to understand how people from various backgrounds across the US participate in the arts.
In 2022 we had our normal survey of public arts participation, but we also had a unique opportunity to work with the General Social Survey and the National Science Foundation to understand how people engaged virtually with the arts during a Covid year.
We always like to see growth. Growth is good. We want to see more people participating in the arts, but a lot of us doing arts and cultural work know that we were in an abnormal time in the last several years and that put a damper on how people engaged with the arts. I expected the numbers to not be as high as five years earlier. That said, we tracked the economic footprint of the arts, working with the Bureau of Economic Analysis. What we saw was in 2020 the arts sector was devastated by Covid and pandemic related restrictions but in 2021 the industry began to clamber out of that with rates of recovery that were promising.
However, looking at the SPPA, or the demand side, we saw that rates are still depressed for in-person arts attendance. We expect to see some stagnancy but to see such sharp drop off was somewhat surprising.
How might arts organizations practically apply this data? Is there an opportunity to develop programs in response to these insights?
The data suggest that we need to do more to understand the types of arts activities that may not fall neatly into the box of one specific discipline. There may be more hybrid or informal arts activities that are capturing the imagination of arts goers. Some of these are large commercial events, but others are local community events where attendance can be harder to track.
A very high percentage of adults, more than 50%, created art over the last year and we saw an uptick in arts and crafts activities such as woodworking and textiles. There seems to be a market for arts programming that harnesses creativity and art-making as part of the value proposition of their programs. There’s also a variety of alternative arts experiences such as comedy, magic shows, or circus arts that can get people to go to events.
At the NEA, studies like these can influence our work. We recently announced ArtsHERE, a significant new initiative to improve arts participation rates nationwide by improving capacity of organizations to address historically under-served communities. This program incentivizes more vigorous community engagement with under-served populations as part of the grantmaking process.
”Very high shares of the population are still participating digitally. Digital arts participation is the most popular way people engage with the arts. The field is recognizing this and is trying to move in a direction of much more virtual activities to supplement in-person ones.
Sunil IyengarDirector, NEA Office of Research & Analysis
How should art organizations be thinking about closing demographic gaps and eliminating barriers to arts participation for marginalized communities?
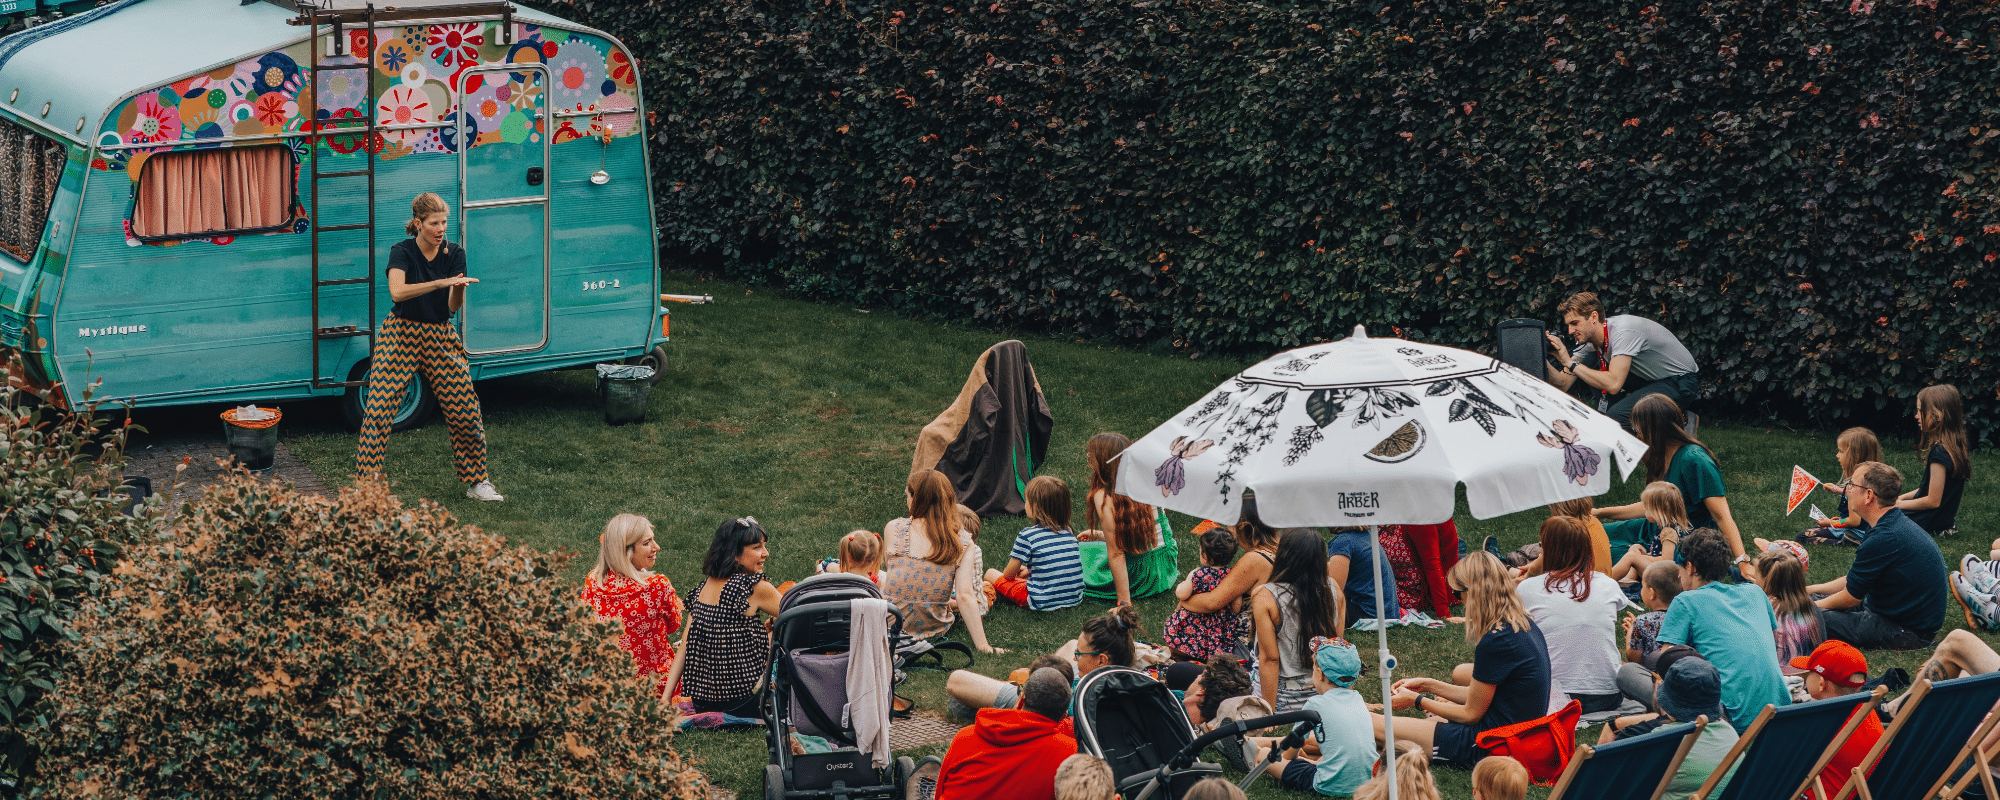
Virtual arts programming that is live streamed, or curated online experiences, sees participation from groups that historically have not been represented as much in attendance—such as African American, Hispanic, Asian, and younger adults. We also know that outdoor venues are among the most popular places for people to attend arts events. These types of events historically attract more demographically diverse audiences as well.
Next year we plan to release state-by-state level arts participation rates to help benchmark how each state’s arts participation is faring compared to the national level. This is in part because the trends we’re seeing at the national level vary significantly across states, especially rural areas.
We’re also planning a deeper dive on demographic data, which will have a better read on which art forms are appealing to certain demographic groups. This might give organization tactical ideas on how to pursue culturally specific programming for their communities.
How can this data be used to demonstrate the value of the sector to foundations, philanthropists, and policy makers?
Almost half of all adults attended some kind of arts or cultural event in 2022—almost half the population are going to arts events! Also, 53 percent of adults did some type of creative arts activity. That’s a sizable part of the population that needs to be addressed by policy makers when they think about who these people are, what they do, and what they do to contribute to social capital in their communities by participating in the arts.
Arts participation numbers are even included in the President’s annual budget document. Tucked away in there are numbers called social indicators. One of them is about arts participation and I think that shows this is a valid way to measure the cultural and social vitality of the nation.


